Q4 2026 Outlook: The Revision of Belief
Imagine Taleb’s Turkey. From its hatching, it had been cared for by ostensibly benevolent humans. They fed him—always plenty of corn to eat, they kept him warm in the winter, they protected him from cats and hawks when he was young, and foxes when he was larger. It was a good life. Every yesterday validated his belief that today will be the same, and that tomorrow would too. Then, suddenly, two weeks before Thanksgiving, the turkey experienced a sudden revision of belief.
What about more gradual revisions of belief? A slow realization that previous assumptions about the world are no longer true. Finance professionals are living through that uncertainty now. Previous assumptions about AI, interest and inflation rates, and demographics are changing. These forces of uncertainty are shaping financial markets and the world even for those who don’t know they are occurring.
Tom Turkey Updates His Priors
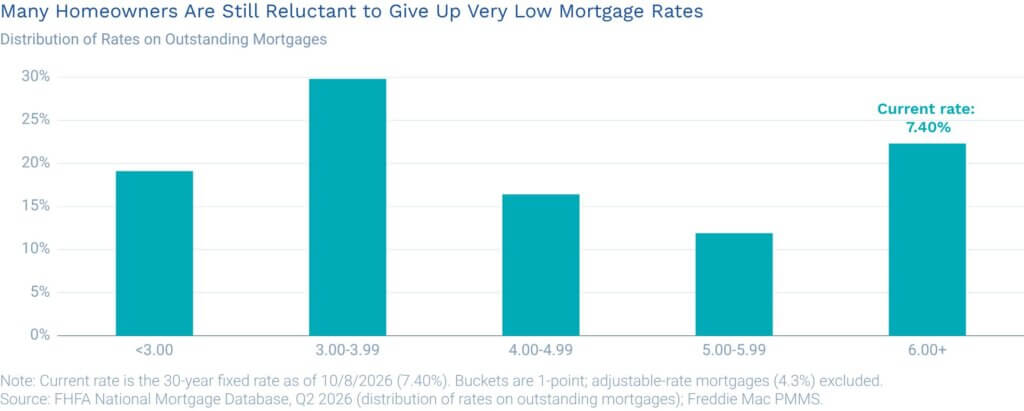
Imagine now Tom Turkey, an average 35-year-old white collar worker. He is currently experiencing a lot of firsts. He has never, as an adult, seen mortgage rates above 7.0%. With his current 4.0% mortgage he’s not going to move anytime soon. He has never experienced a true bear market—he was only 17 when the 2008 crisis occurred. AI is new for him too. He wonders what job he should tell his children to study for—isn’t AI going to disrupt every job? He sees how much his AC bill costs in the summer and knows the demand for power is now increasing— the first time that has happened in his lifetime. With so much of the world changing, what should investors do?
Uncertainty is THE investing theme of 2026. Think of AI, interest rates and inflation, energy, and demographics. Each element has been stable for a generation, and each has now strayed into new territory. Previous assumptions about the world have not held, and there is little expert consensus on what replaces them. These narratives will shape the remainder of the year and 2027.
We discuss the market impact of these factors after a review of Q3 market activity.
U.S. and Global Market Summary
Global Real GDP Growth Broadly Unchanged: The IMF projects growth of 3.1% in 2026 and 3.4% in 2027, a 0.1-pt upgrade from April, as AI-driven demand offsets the Middle East war’s drag on energy importers.
U.S.-Iran Conflict Causing Elevated Brent Prices: Brent crude is sitting above $109 a barrel as of early October, up over 80% from a year ago. Export constraints expected to persist through year-end, with Brent averaging $105 in the second half of 2026 before easing in 2027.
Consumer Confidence Near All-Time Low: The University of Michigan Consumer Sentiment Index fell to the second-lowest level in its 74-year history. Americans expect gas prices to keep climbing, and expect inflation of 4.7% over the next year.
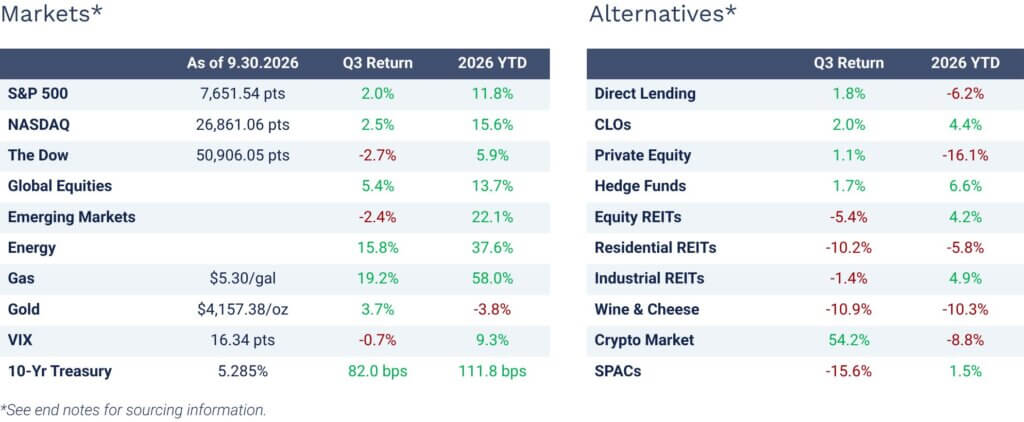
AI Rally Powers Through Rate Spike: The Nasdaq broke the 27,000 threshold in September and the S&P 500 finished at near highs before a jump in bond yields sparked a pullback in the final week. Both still finished the quarter higher, while the Dow slipped.
Economic Performance
Global Growth Set to Cool After a Strong Finish to 2026: The Atlanta Fed’s GDPNow model estimates the economy grew at a 3.5% annualized rate in Q3, well above Q2’s 2.2%. The first official Q3 reading is due October 29, and the Fed expects growth to settle near 2.4% next year.
Hiring Hits the Brakes: Employers added just 29,000 jobs in September, about a third of what economists expected, while unemployment rose to 4.2%. Healthcare did most of the hiring, while more than 25% of job seekers have been looking for over six months.
Inflation Stays Sticky: Consumer prices rose 3.7% over the past year, with gasoline driving over half of the monthly increase. Core PCE (which strips out food and energy) came in cooler than expected at 3.0% but remains well above the Fed’s 2% target.
Mortgage Rates Break 7%: The average 30-year mortgage rate rose to 7.40% by the beginning of October. Freddie Mac’s weekly survey crossed 7% on September 24 for the first time since January 2025. Home sales slipped again in August, while the supply of homes for sale hit its highest level in over a decade, giving buyers more bargaining power.
Monetary Policy
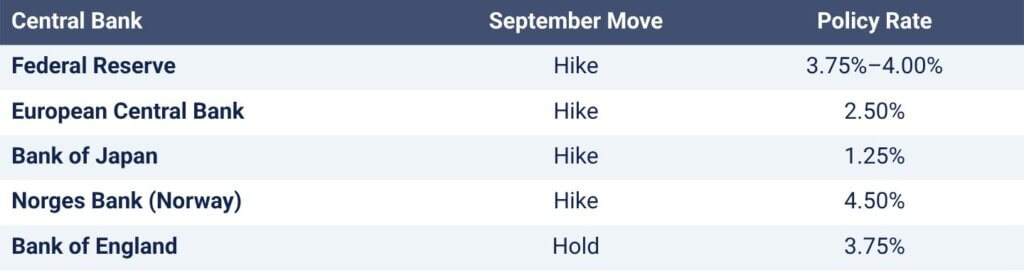
Fed Hikes for the First Time Since 2023: The Fed raised rates to 3.75%–4.00% on September 16. Officials’ projections point to one more hike this year and no cuts in 2027. Markets now see roughly a 16% chance of another hike at the October 28 meeting.
Warsh Rewrites the Playbook: Chair Warsh stated, “I’m not in the forward guidance business,” after the September meeting. “Trends matter. Data points are noisy.” Expect fewer hints about the Fed’s next move, and bigger market reactions to each meeting.
The World Tightens Together: Central banks are raising rates to fight energy-driven inflation. The ECB, Bank of Japan and Norway’s central bank all hiked in September, while the Bank of England held.
Credit Market Performance
Rate Spike Hits Bonds; Loans Hold Up: A late-September selloff pushed both high-yield and investment-grade bonds into the red for Q3, with longer-duration investment grade hit hardest. Floating-rate loans held up better. Spreads widened in the final week but remain tight by historical standards.

Private Credit Pricing Power Grows: Direct lenders are getting paid more to lend. New private loans now pay about 1.6% more than comparable syndicated loans, up from roughly 1.2% in Q1, while credit quality in core sectors like software remains solid.
Stress Concentrated in Small Borrowers: Direct lending stress is mostly a small-company problem. Among borrowers with less than $20 million in annual earnings, 12% of loans are now valued below 90 cents on the dollar, up from 1% in 2023. Overall direct lending defaults remain under 1% of loan value, with healthcare the most stressed sector.
Software Overcomes AI Disruption Fears (For Now): After a rough first half, software loans were the top-performing sector in August and led the loan market again in September. The bigger test comes in 2027–2028, when a large wave of software debt comes due.
AI Data Center Debt Financing Accelerates: Big Tech is borrowing more to fund AI. Hyperscalers are on pace to issue about $250 billion in investment-grade bonds this year, more than double 2025, and Goldman Sachs expects that to climb to roughly $420 billion in 2027 as debt funds over a third of AI spending.
AI – We Are Just Getting Started
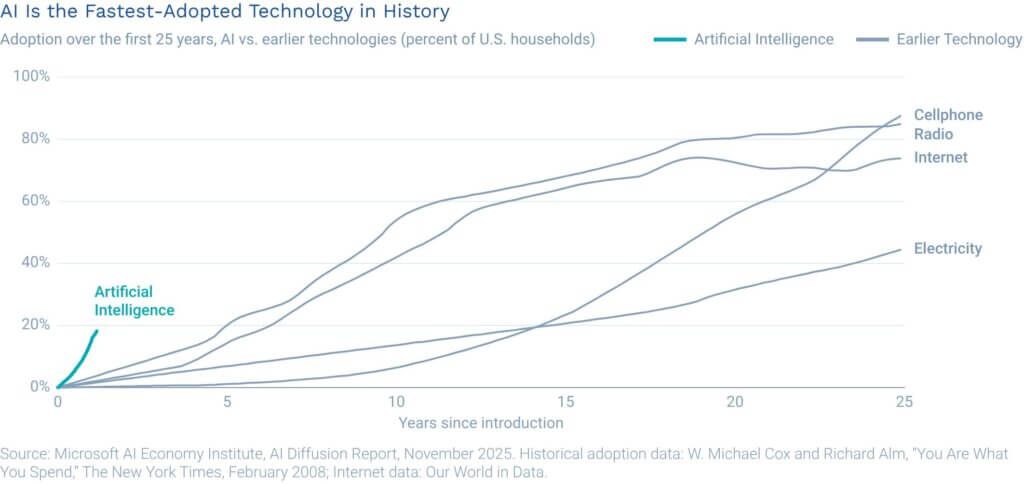
Is it just a toy or a tidal wave sweeping over and swamping every other aspect of work, art, and society? AI is now so embedded in the world that it’s easy to forget that ChatGPT was first released in November 2022. AI has been adopted faster than any technology in history.
AI continues to advance. Navier–Stokes is solved¹. But the demand for AI is nowhere near satisfied. Less than 25% of workers use AI daily. And for personal use, penetration is low. Fewer than 3% of households have a paid AI subscription.
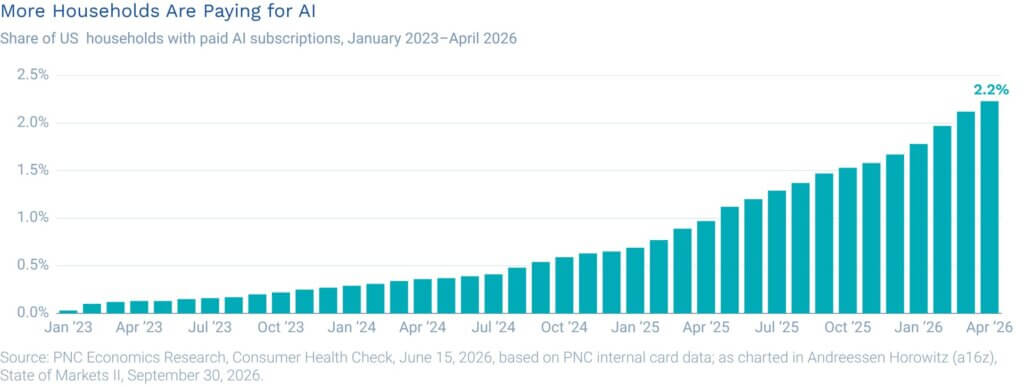
In other words, there is a lot more demand possible. In the meantime, AI’s expansion will require a lot more infrastructure investment, grid expansion, and capital.
Interest Rates and Inflation – Higher for Longer
Both interest rates and inflation were low starting from the financial crisis through COVID. Low rates drove the financialization of the economy, private equity primacy, wage stagnation, asset inflation. This was the turkey being fed and protected. Now, it’s Thanksgiving. For many people, post-COVID is the first time they have seen 7% mortgage rates and inflation above 2%.
The effective fed funds rate averaged well under 1% from 2009 through 2021, the 10-year Treasury spent most of that stretch below 3%, and a 30-year mortgage could be had for three-and-change. Homebuyers, corporate treasurers, and lenders built their models, their habits, and their intuitions on that regime.
The 2022 shock looked, for a while, like a storm that would pass. By late 2025 the Fed had cut three times to 3.50%–3.75%, and the old script—inflation fades, rates drift back down—seemed to be reasserting itself. It was not to be. On September 16, 2026, the FOMC, under Chair Kevin Warsh, voted unanimously to raise the target range to 3.75%–4.00%, the first increase since 2023, citing solid growth, elevated inflation, and, pointedly, geopolitical developments.
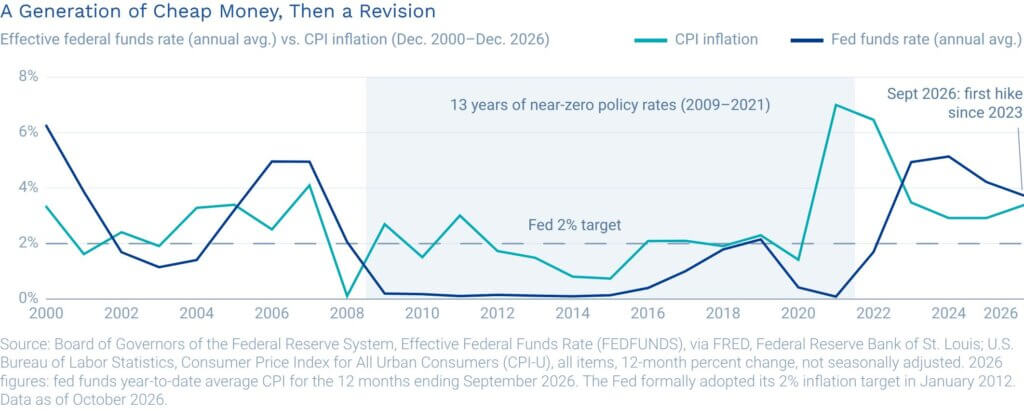
Long rates continue to rise. The 10-year Treasury ended the quarter at 5.29%, its highest since 2007 after the largest quarterly rise this century; the 30-year touched levels last seen in 2004; and the 30-year mortgage is back above 7%.
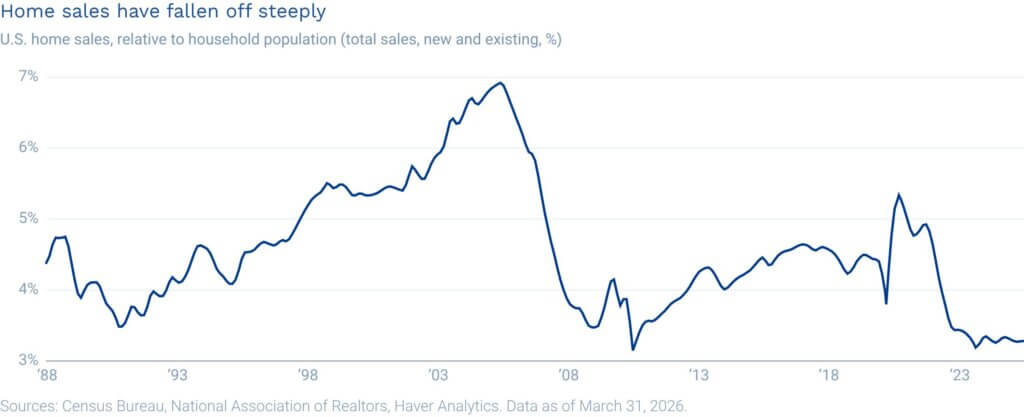
For borrowers who came of age believing 7% mortgages and 3% inflation were mere historical curiosities, the gradual awakening continues. The housing market is locking up due to higher rates and borrowers reluctant to borrow at higher rates. For investors, bonds are beginning to look attractive again as the term premium is being rebuilt after a fifteen-year holiday. Floating rate lenders have a natural hedge while fixed rate lenders have seen steep price declines.
Energy – We Need More
From roughly 2007 to 2020, U.S. electricity generation did not grow. Efficiency gains kept overall consumption flat as population grew. A utility planner could assume flat load forever, so capacity was not built.
China, meanwhile, went from roughly 1,400 terawatt-hours in 2000 to about 10,600 in 2025, two and a half times U.S. output. In 2025 alone it added nearly 500 TWh of generation, about the size of Germany’s entire grid, and 550 gigawatts of capacity.
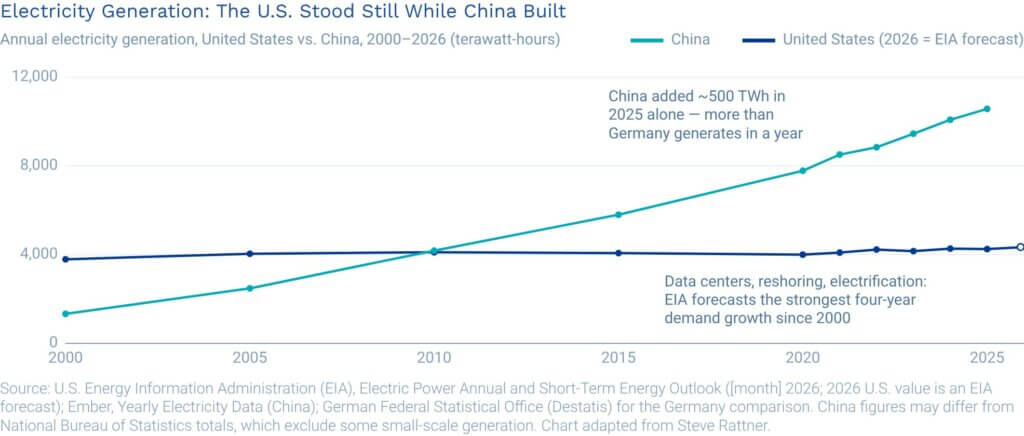
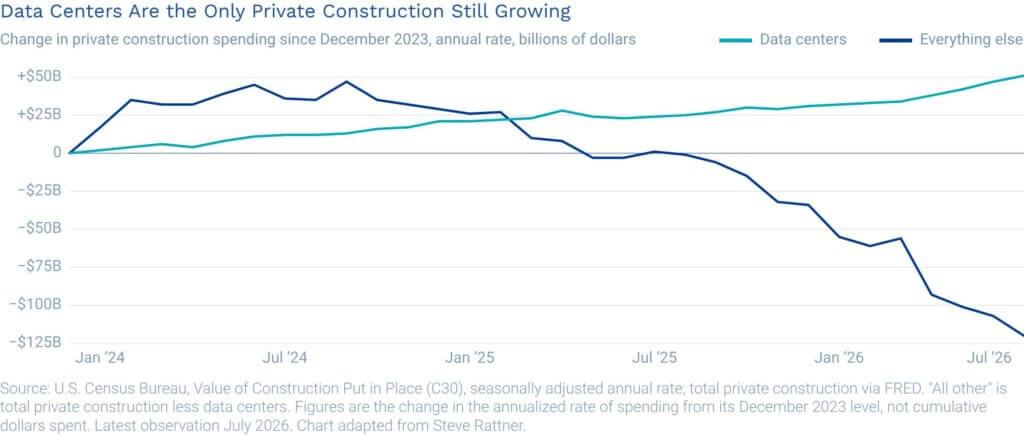
We are now playing catchup. Data centers, reshored manufacturing, and the electrification of homes and transport have pushed U.S. demand onto a new trajectory. Whether the hyperscalers' announced capacity will actually be built, and on what timeline, is one of the genuinely open questions of the year. What is not in question is that the grid was sized for the old world.
Closing that gap is an infrastructure problem and an energy problem. Investor-owned utilities plan on the order of $1.1 trillion of capital spending over 2025–2029, most of it grid and generation, and the IEA estimates global grid investment must roughly double from about $400 billion a year to keep pace with electrification. Add the hyperscalers’ own build—data center capital spending now runs in the hundreds of billions annually and is increasingly debt-financed—and the total is on a scale that public budgets and utility balance sheets cannot carry alone.
That is why infrastructure investing is now a focus of institutional investors. Generation, transmission, pipelines, LNG terminals, and the digital backbone of data centers and fiber are long-lived assets with contracted or regulated cash flows, often inflation-linked, being built because they must be. Private capital is increasingly the source of both the equity and the credit behind them. The old belief—that infrastructure was a sleepy, low-return corner of the market—is being revised along with everything else.
Demographics
In 1968, Paul Ehrlich’s book “The Population Bomb” was a best seller. It warned that we were entering a new Malthusian age where population growth would exceed food supplies. Mass starvation and social collapse were sure to follow. He was wrong, of course. Prophets of doom usually are.
The U.S. total fertility rate fell to about 1.6 births per woman in 2024, a record low and well under the 2.1 replacement level. South Korea’s is near 0.75, Japan’s about 1.15, and China’s has fallen to roughly 1.0, with its population shrinking for a fourth consecutive year. For a generation the working assumption was that populations grow, labor forces expand, and consumer markets with them. That is no longer true almost anywhere in the developed world. Pension funds and social spending will be forced to adjust over the next decades.
For investors, the demographic math surfaces as slower trend growth, entitlement burdens that keep pressure on deficits and long rates, wage inflation in physical industries, and secular demand for housing, healthcare, and automation.
Now What?
The turkey’s error was not optimism; it was mistaking a long run of confirmations for proof. Across each theme—AI, rates and inflation, energy, demographics—a generation-long assumption has been changed, gradually and then all at once, and the experts disagree about what replaces it. For investors the practical lesson is humility about the base case and attention to what is being rebuilt. Tom Turkey, unlike his namesake, still gets to revise his beliefs and act on them. So do we.
¹ For nearly two centuries, the Navier-Stokes equations have been relied on by engineers but not proven by mathematicians. The million-dollar question (literally: it’s one of the seven Clay Mathematics Institute’s $1 million prize problems) was whether the equations always remain smooth, or whether they can sometimes blow up into mathematical nonsense. The problem remained intractable until September 2026 when OpenAI announced that its AI agents had solved it. There was applause and then revulsion from the math community. As journalist Derek Thomopson describes the mathematicians: “…some are crying about bruised egos, the feeling of wasted years, a creeping sense of status obliteration, the frustration of an unfair competitor, the indignation of feeling cheated and mistreated, and uncertainty about the future.”
Endnotes
Source: Bloomberg Index Services Limited. BLOOMBERG® is a trademark and service mark of Bloomberg Finance L.P. and its affiliates (collectively “Bloomberg”). Bloomberg or Bloomberg’s licensors own all proprietary rights in the Bloomberg Indices. Bloomberg does not approve or endorse this material or guarantee the accuracy or completeness of any information herein, nor does Bloomberg make any warranty, express or implied, as to the results to be obtained therefrom, and, to the maximum extent allowed by law, Bloomberg shall not have any liability or responsibility for injury or damages arising in connection therewith.
“S&P 500” represented by the S&P 500 index. “NASDAQ” represented by the NASDAQ Composite Index. "The Dow" represented by the Dow Jones Industrial Average. "Global Equities" represented by MSCI ACWI Index. “Emerging Markets” represented by the iShares MSCI Emerging markets ETF. "Energy" represented by Energy Select Sector SPDR Fund (XLE). “Gas” represented by the AAA national average price of regular gasoline. “Gold” represented by the SPDR Gold Shares “VIX” represented by the Chicago Board Options Exchange’s CBOE Volatility Index. "10-Yr Treasury" represented by U.S. 10-Year Treasury Yield. “Direct Lending” represented by the DLX Direct Lending Index. “CLOs” represented by the Palmer Square CLO Debt Index. “Private Equity” represented by the Invesco Global Listed Private Equity ETF. “Hedge Funds” represented by the Bloomberg All Hedge Fund Index. “Equity REITs” represented by the MSCI World Equity REIT Index. “U.S. Residential REITs” represented by the MSCI US Residential REIT Index. "Industrial REITs" represented by FTSE NAREIT Equity REITS. "Wine & Cheese" represented by the Bloomberg Wine & Cheese Index. “Crypto Market” represented by the Bloomberg Galaxy Crypto Index. "SPACs" represented by S&P SPAC Index.
The indices shown are provided solely for illustration purposes and not indicative of any investment. You cannot invest directly in an index. They have not been selected to represent appropriate benchmarks or targets for the strategy. The indices include the reinvestment of dividends, interest and other earnings and which have not been adjusted for management fees or expenses.
The information contained within is for educational and information purposes ONLY. It is not intended nor should be considered an invitation, inducement to buy or sell any security or a solicitation to buy or sell any security. The information is not designed to be taken as advice or a recommendation for any specific investment product, strategy, plan feature or other purpose in any jurisdiction, nor is it a commitment from us or any of our subsidiaries to participate in any of the transactions mentioned herein. Any commentary provided is the sole opinion of the author and should not be considered a personal recommendation. This is also not intended to be a forecast of future events nor is this a guarantee of any future result. Both past performance and yields are not reliable indicators of current and future results. Information contained herein was obtained from third party sources we believe to be reliable; however, this is not to be construed as a guarantee to their accuracy or completeness. Observations and views contained in this report may change at any time without notice and with no obligation to update. All investments carry a certain degree of risk, including possible loss of principal and there is no assurance that an investment will provide positive performance over any period of time. There are specific risks associated with investing in various types of financial assets and in different countries. The information contained within should not be a person’s sole basis for making an investment decision. One should consult a financial professional before making any investment decision. Investors should ensure that they obtain all available relevant information before making any investment. Financial professionals should consider the suitability of the manager, strategy, and program for their clients on an initial and ongoing basis. CION Securities, LLC, Member FINRA/SIPC.