

Q3 2026 Outlook: The Real Reason Investors are Always Dissatisfied
“Annual income twenty pounds, annual expenditure nineteen nineteen and six, result happiness.
Annual income twenty pounds, annual expenditure twenty pounds ought and six, result misery.”
— David Copperfield
Mr. Micawber’s arithmetic in David Copperfield applies to investors too. Happiness, he insists, is not a function of how much you have. It is a function of expectations: how much you have measured against how much you expected to have. Others have made the same point, that happiness is relative. A modest result against modest hopes can feel like contentment; a spectacular result against stratospheric hopes can feel like failure.
The great writer and Nobel prize winning Solzhenitsyn, in his book A Day in the Life of Ivan Denisovich, pushed this philosophy to its limit. His prisoner, surviving a freezing Soviet labor camp on his wits and pilfered gruel, counts a smuggled mason’s trowel among the genuine strokes of luck in his day—just one day of his ten year sentence, 3,653 days (the extra three days were for the leap years). Satisfaction tracks expectations, not absolutes.
One of the most reliable facts in investing is that investors are perpetually dissatisfied. And not because conditions are uniquely bad. They are unhappy because conditions are never absolutely perfect, and the expectation of perfection is the one market condition that never arrives.
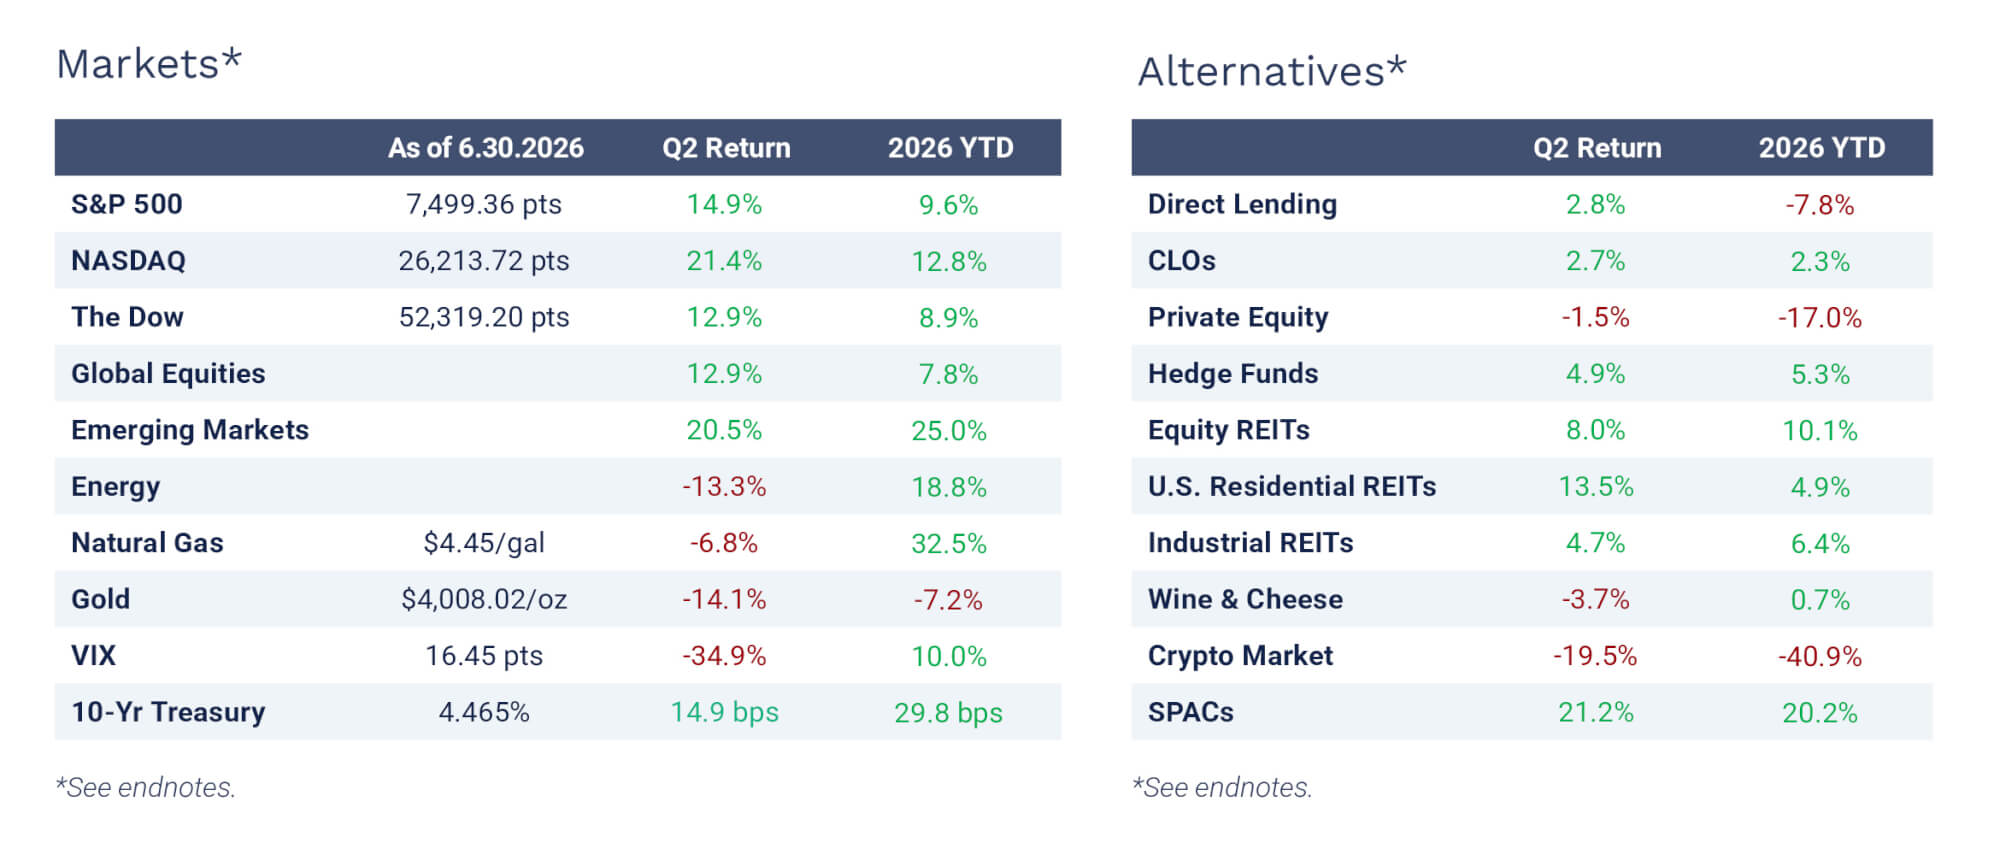
As of this writing the S&P 500 sits near an all-time high, having closed above 7,600 for the first time in early June. And yet, per an Allianz study published in late June, only one in four Americans believes it is a good time to invest, which is the most cautious reading in four years. The gap between those two facts is the subject of this outlook, which we explore after we review the market and economic activity in Q2.
U.S. and Global Market Summary
Economic Growth Trajectory Slows: The World Bank now projects global growth slowing to 2.5% in 2026, down from 2.9% in 2025 — the weakest pace since the pandemic — as the Middle East conflict drove energy prices higher and renewed inflationary pressure.
Consumer Confidence Begins to Heal: The University of Michigan Consumer Sentiment Index rebounded roughly 10% in June, as gas prices moderated and consumers' worries over the long-term consequences of the Iran conflict began to ease. Even with the bounce, confidence remains 20% below where it was a year ago.
Inflation Reignites as Energy Bites: Hard data confirm what sentiment surveys fear. The Consumer Price Index rose 0.9% in March, its latest reading, as gasoline prices climbed, and the energy shock fed through to consumer prices.
Labor Market Proves Resilient: Employers added 57,000 jobs in June, far below the ~115,000 expected. Unemployment held at 4.2%, historically moderate and near most estimates of full employment.
Economic Performance
U.S. Growth Steady: The economy kept expanding through Q2 despite the energy shock. The Atlanta Fed's GDPNow model tracked roughly 2.5% real GDP growth as of late June, holding near the 2.1% pace recorded in Q1.
Low Fire, Low Hire, Job Market Mire: Unemployment shook out to 4.2% in June, largely unchanged from the previous 3-month stretch at 4.3%. Currently the share of workers stuck in long-term unemployment is near cycle highs at 27.3%, still up from 23.3% a year ago.
Inflation Back Above 4%: The energy shock did what it was expected to do. Headline CPI reached 4.2% in May, the fastest annual pace in three years and up sharply from 2.4% a year earlier, driven almost entirely by energy, which rose more than 23% YoY. Core inflation, which strips out food and energy, stayed comparatively contained at 2.9%. The Fed's own June projections see inflation easing only gradually, with its preferred PCE gauge still running at 3.6% by year-end.
Housing Found Its Footing: After last quarter's rate spike, the mortgage market settled. The 30-year fixed averaged 6.49% as of late June, down from 6.77% a year ago, and has held a narrow mid-6% range for roughly six weeks. Fannie Mae expects rates to hold near 6.4% through year-end, with little relief likely before 2027.
Monetary Policy
Fed Holds Rates, Leans Toward a Hike: The FOMC held the federal funds rate at 3.50%–3.75% on June 17, the fourth consecutive pause. Officials' central 2026 rate projection rose to 3.8% from 3.4% in March, pointing to a hike rather than a cut, with the year-end PCE inflation forecast (the Fed's preferred gauge) up to 3.6% from 2.7%.
Warsh Takes the Helm: Kevin Warsh took office in May as the 17th Fed chair, succeeding Jerome Powell. Warsh's first meeting brought a much shorter statement that dropped the committee's "easing bias," plus a broad five-task-force review of how the Fed operates.
Balance Sheet Back in Focus: One of Warsh's new task forces will review the Fed's roughly $6.7 trillion bond holdings (its "balance sheet"), a footprint he has long argued should be pared back. The Fed stopped reducing those holdings in December 2025, so any move to resume would tighten financial conditions on its own, independent of interest rates.
Credit Market Performance
Credit Market Returns: Performance for Q2 2026: High yield (HY) +2.47%, investment grade (IG) +1.40%, leveraged loans +1.88%, and direct lending +2.8%. Direct lending is currently down (7.8%) on the year as its Q2 performance couldn’t make up for a rough Q1.
A Market Split in Two: The loan market split sharply between safe and risky borrowers in the second quarter. The weakest companies now pay about 4.1 percentage points of extra interest to borrow, up from roughly 3.5 points at the end of 2025, while safer borrowers saw little change, and loans trading at distressed prices (a sign investors doubt they'll be repaid in full) have risen to about 12% of the market.
Software Loses Its Throne: Software companies, long the biggest borrowers here, fell out of favor fast: their share of new leveraged loans dropped to 8.6%, from 17.6% in 2025 and the lowest since 2013, on fears that AI could erode their business. Their loans lagged too, losing about 4.7% of their value so far this year through May as the broader market gained about 1.2%.
Why Investors Wait
There is a durable gap between economic reality and investor sentiment. Sentiment is not a clean reading of the data: it is an emotional response to it. This is another way of saying that people decide how they feel first and find reasons after. The Allianz finding above is a textbook example: indices at records, sentiment at a four-year low. So why does the dissatisfaction never lift?
Approach–Avoidance: The Conflict that Strengthens as You Near the Goal
Psychologist Kurt Lewin described the mechanism in 1935. A single goal can generate both an approach motivation (the desire to obtain it) and an avoidance motivation (the desire to dodge the discomfort of obtaining it). You want to learn to play the piano, but it’s hard to put the phone down and just do your scales. Lewin’s key finding: the avoidance motivation grows stronger the closer you get to the goal. This is why an investor can discuss investing calmly in the abstract yet feel acute anxiety with the cursor hovering over “confirm.” Even worse for investors is that the longer uncertainty persists, the more entrenched it becomes. An investor who has been waiting twelve months faces a harder psychological task than one who has waited twelve days—the avoidance habit is now engrained.
Researchers have found that the dependable way out of approach–avoidance conflict is not more willpower, it is a structural change to the decision itself. The relevant structure is pre-commitment: making the decision when avoidance is weakest, and binding it to execute on a defined future schedule regardless of conditions. More on why this works below.
Scared Bears Lose Money
Skepticism always sounds smarter than optimism. It is also, over long horizons, far more expensive. Consider the two names that anchored the last half-decade of returns.
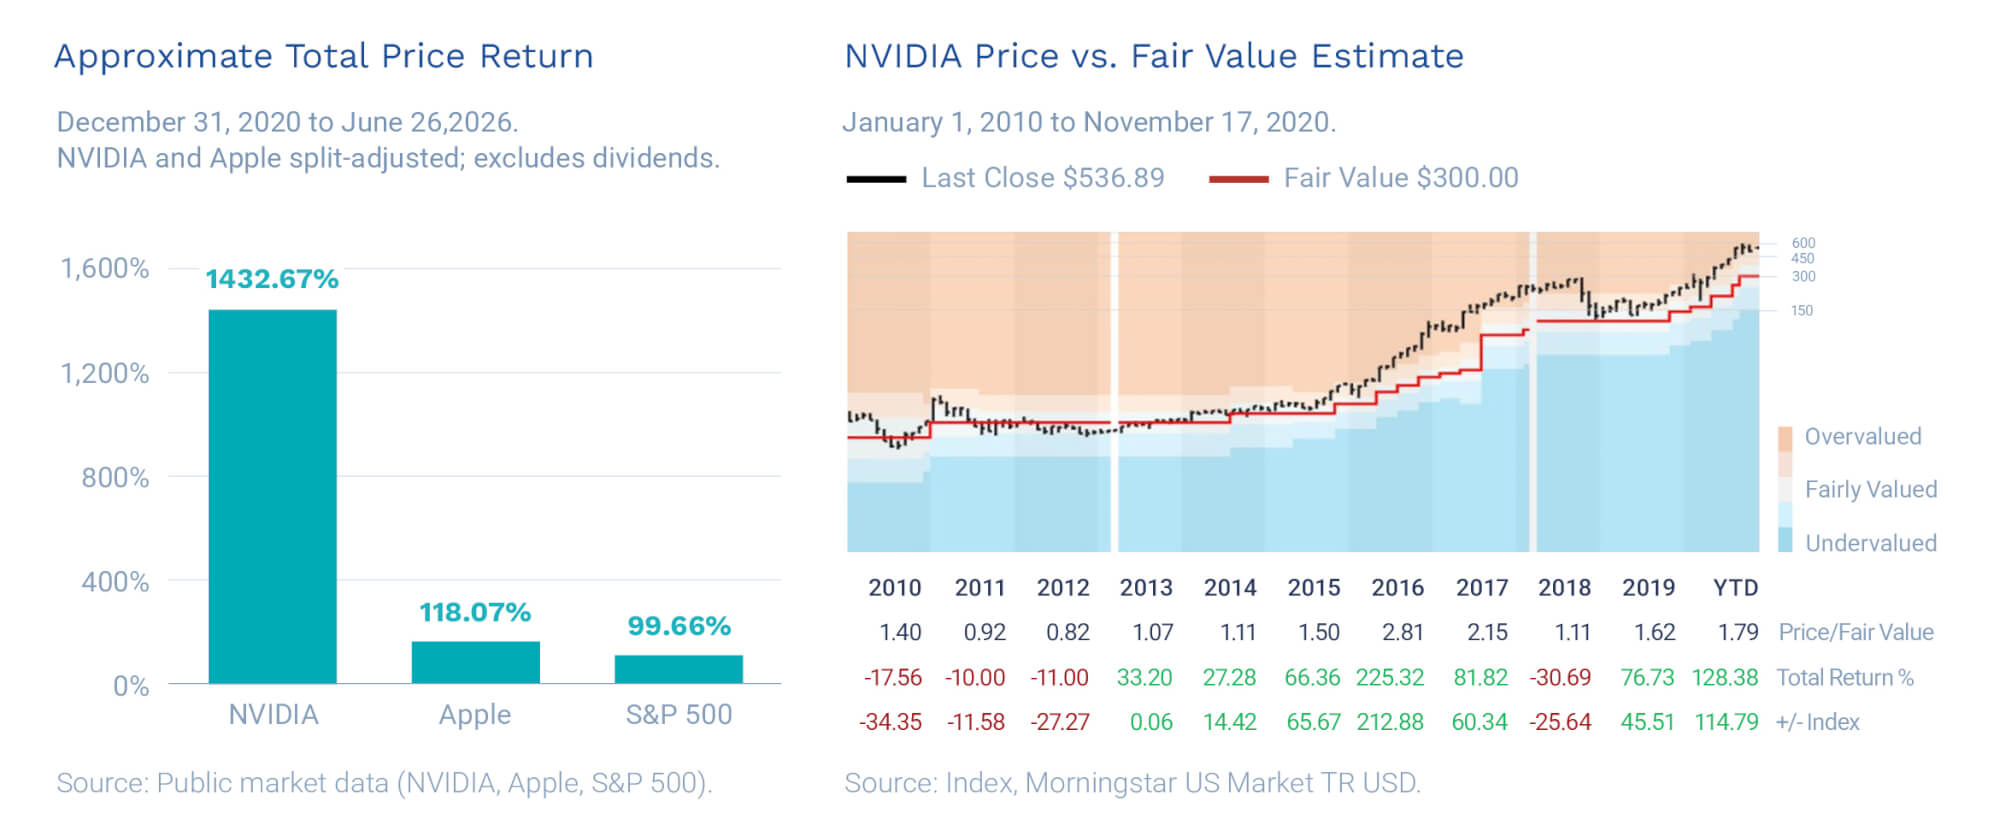
At the end of 2020, plenty of serious people thought both were too expensive.
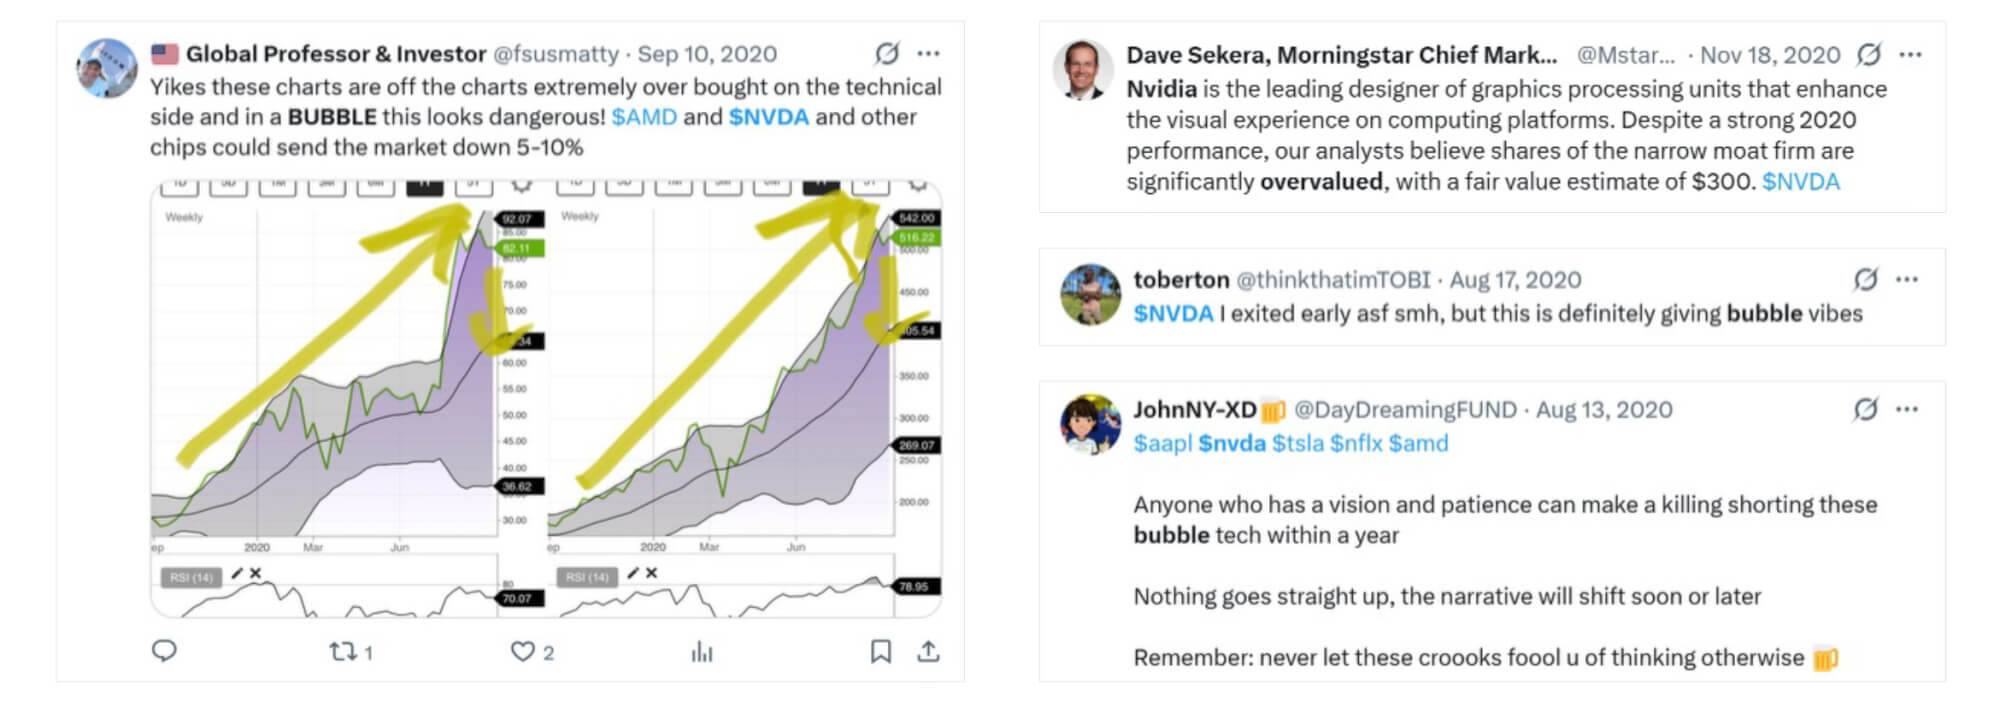
NVIDIA closed that year around $13 a share (split-adjusted); it trades near $200 today, for a roughly a sixteen-fold gain. Apple closed 2020 near $133; it is around $310 now, more than double. The skeptics were not silenced by the run. As recently as 2024, a valuation authority called NVIDIA “a bridge too far” and trimmed his stake; a major activist fund pronounced it “bubble” territory. Both may yet be proven right on timing. But the investor who acted on that caution in 2020 (or 2022 or 2024) missed a generational compounding event while waiting to be told it was safe.
Panic! At the Stock Exchange—Negative Headlines Get Clicks
Emotional sentiment repeats in predictable waves. Investors who fled to cash at the March 2009 low (the S&P bottomed near 666) missed a multi-year advance of several hundred percent. Those who sold at the COVID trough in March 2020, when the index touched roughly 2,237, watched it more than triple from there. Amazon, left for dead after the dot-com bust, became one of the most valuable companies on earth. In every case the highest level of fear marks something much closer to an entry than an exit.
It is the narrower point: the cost of being out of the market during recoveries has consistently exceeded the cost of being in it before declines. Fear is just a passing feeling, and not a reliable forecast. Investors who constantly check the news and their portfolio are experiencing a daily emotional whiplash, and might feel compelled to take some action. Those investors who check their portfolio less frequently or who hold lower volatility investments will be less inclined to make rash decisions.
Taking the Long View
The practical response is to recognize that there is no perfect entry point. The best protection an investor has is to lengthen their investing horizon until the entry stops mattering. The data supports this approach.
Over a single month, the market has been positive about 63% of the time. Stretch the holding period and the odds improve: 75% over one year, 89% over five, and 100% over every twenty- and thirty-year window in the historical record. In other words, every rolling twenty-year period in U.S. history has produced positive real equity returns.
Market timing fails not because it is hard to be right once, but because it requires being correct twice: when to leave and when to return. The Schwab Center for Financial Research’s long-running timing study says that across multi-decade horizons, investing immediately each year nearly matches the returns of a hypothetical investor with perfect timing, and an investor who simply held cash waiting for a better moment finishes far behind. Most strikingly, even an investor cursed to buy only at each year’s market peak still ends up well ahead of the one who stayed in cash. Being invested at a bad time beats not being invested.
Conclusion
"The investor's chief problem—and even his worst enemy—is likely to be himself." — Benjamin Graham
There will always be a reason to wait. In Q2 2026 it was a recession that hasn’t arrived, an oil shock that de-escalated, an AI rally that wobbled, and a Fed that wouldn’t cut. Outsized withdrawals from private credit funds this year are a symptom of the same issue—investors ignoring historical precedent to exit due to bad headlines, while institutional investors continue to allocation to the asset class. A year from now the headlines will differ and the feeling will be identical. The investors who do well are not the ones who find the perfect moment but the ones who decide, in advance, that they will participate in the long compounding the data so plainly rewards, and then get out of their own way.
Endnotes
Source: Bloomberg Index Services Limited. BLOOMBERG® is a trademark and service mark of Bloomberg Finance L.P. and its affiliates (collectively “Bloomberg”). Bloomberg or Bloomberg’s licensors own all proprietary rights in the Bloomberg Indices. Bloomberg does not approve or endorse this material or guarantee the accuracy or completeness of any information herein, nor does Bloomberg make any warranty, express or implied, as to the results to be obtained therefrom, and, to the maximum extent allowed by law, Bloomberg shall not have any liability or responsibility for injury or damages arising in connection therewith.
“S&P 500” represented by the S&P 500 index. “NASDAQ 100” represented by the NASDAQ 100 Index. "The Dow" represented by the Dow Jones Industrial Average. "Global Equities" represented by MSCI ACWI Index. “Emerging Markets” represented by the iShares MSCI Emerging markets ETF. "Energy" represented by Energy Select Sector SPDR Fund (XLE). “Natural Gas” represented by the United States Natural Gas Fund LP. “Gold” represented by the SPDR Gold Shares. “VIX” represented by the Chicago Board Options Exchange’s CBOE Volatility Index. "10-Yr Treasury" represented by U.S. 10-Year Treasury Yield. “Direct Lending” represented by the DLX Direct Lending Index. “CLOs” represented by the Palmer Square CLO Debt Index. “Private Equity” represented by the Invesco Global Listed Private Equity ETF. “Hedge Funds” represented by the Bloomberg All Hedge Fund Index. “Equity REITs” represented by the MSCI World Equity REIT Index. “U.S. Residential REITs” represented by the MSCI US Residential REIT Index. "Industrial REITs" represented by FTSE NAREIT Equity REITS. "Wine & Cheese" represented by the Bloomberg Wine & Cheese Index. “Crypto Market” represented by the Bloomberg Galaxy Crypto Index. "SPACs" represented by S&P SPAC Index.
The indices shown are provided solely for illustration purposes and not indicative of any investment. You cannot invest directly in an index. They have not been selected to represent appropriate benchmarks or targets for the strategy. The indices include the reinvestment of dividends, interest and other earnings and which have not been adjusted for management fees or expenses.
The information contained within is for educational and information purposes ONLY. It is not intended nor should be considered an invitation, inducement to buy or sell any security or a solicitation to buy or sell any security. The information is not designed to be taken as advice or a recommendation for any specific investment product, strategy, plan feature or other purpose in any jurisdiction, nor is it a commitment from us or any of our subsidiaries to participate in any of the transactions mentioned herein. Any commentary provided is the sole opinion of the author and should not be considered a personal recommendation. This is also not intended to be a forecast of future events nor is this a guarantee of any future result. Both past performance and yields are not reliable indicators of current and future results. Information contained herein was obtained from third party sources we believe to be reliable; however, this is not to be construed as a guarantee to their accuracy or completeness. Observations and views contained in this report may change at any time without notice and with no obligation to update. All investments carry a certain degree of risk, including possible loss of principal and there is no assurance that an investment will provide positive performance over any period of time. There are specific risks associated with investing in various types of financial assets and in different countries. The information contained within should not be a person’s sole basis for making an investment decision. One should consult a financial professional before making any investment decision. Investors should ensure that they obtain all available relevant information before making any investment. Financial professionals should consider the suitability of the manager, strategy, and program for their clients on an initial and ongoing basis. CION Securities, LLC, Member FINRA/SIPC.