The Tale of the Yield Curve
Signal Definer: Bifurcated. Equities shrugged off sanctions, geopolitical uncertainty, inflation and rate increases. Bonds struggled with rate increases.
The Tale of the Yield Curve
Signal Definer: Bifurcated. Equities shrugged off sanctions, geopolitical uncertainty, inflation and rate increases. Bonds struggled with rate increases.
The S&P 500 Index returned 3.58%
The Bloomberg U.S. Aggregate Bond Index returned -2.77%
Fed Funds Target Range: 0 – 0.25%
The Federal Reserve held the monthly FOMC meeting and raised the key short-term interest rate by 25 basis points. What wasn’t expected was Fed Chairman Powell’s subsequent remarks about the pace of rate increases. “There is an obvious need to move expeditiously to return the stance of monetary policy to a more neutral level, and then to move to more restrictive levels if that is what is required to restore price stability.”
Markets interpreted ‘expeditiously’ to mean that 50 basis point hikes would be deployed at the next round because the language change was from raising rates “steadily” in January, which the Fed translated to 25 basis point rate increases.
What Powell is attempting with the return of monetary policy to a “neutral level” is to raise rates as high and as quickly as possible, to take excess liquidity resulting from stimulus out of the system while the labor market continues to be very strong. If further rate hikes are necessary to control inflation, in theory, the Fed will have more control as it balances rate increases and supporting a growing economy.
A normal curve of the different yields related to the maturities of U.S. Treasury securities rises as maturities get longer. The yield curve “flattens” when the spread narrows between a pair of maturities, for example, the 5-year and the 30-year. When the yield on shorter-term Treasuries rises above the yield on longer-term Treasuries, the curve is said to “invert.”
Essentially, an inversion is created because bond investors are betting that the economy will slow in the future. Markets appear to think that the Fed will overshoot, stall out the economy, and decrease rates all over again.
When the yield curve inverts for an extended period, a recession tends to follow. Not right away – it’s usually months or even years before the economy catches up to the bond market’s signal of no- confidence. But as an indicator, it’s pretty accurate.
The inversion was triggered by the release of the very strong March employment number. The March non-farm payroll increase was 431,000 jobs, which pushed the unemployment rate down to 3.6%, from 3.8%. The fifty-year-low unemployment rate is 3.5%, which we hit just before the pandemic. The concern is that the strong labor market is supporting higher wages and prices. Fighting inflation could force the Fed into a series of 50-basis point hikes, which could stifle growth and lead the economy into recession. The significance of the 50-basis point hikes is that we haven’t seen one in 22 years. But that’s just one scenario.
Not all yields along the curve are inverted. The Atlanta Fed plots the markets’ expectations for the Fed funds rate. The calculations show a rate that peaks at 3% in the fall of 2023, then drifts slowly downward to 2.5% by the spring of 2025. This looks like the 2019 yield curve inversion, which was followed by some gentle “mid-cycle” rate cuts that worked.
Volatility is increasing: In March, 14 of the 23 days posted at least a 1% change in price of the S&P 500. This is an increase over last month, when there was a 1% change on 10 of 19 trading days. In January, it was eight of the 20 trading days. Preliminary earnings and sales for the fourth quarter of 2021 have beaten expectations, as they did in the first three quarters of the year. They are also setting new quarterly records. For the quarter, 75.6% of S&P 500 companies exceeded operating estimates. All 11 S&P 500 sectors were positive for the month.
The 10-year U.S. Treasury ended the month at 2.34%, and the 30-year U.S. Treasury ended at 2.45%. The Bloomberg U.S. Aggregate Index was down, returning -2.77. As represented by the Bloomberg Municipal Bond Index, municipal bonds returned -3.24%. High yield corporate bonds struggled with rising rates, with a return of -1.14% for the Bloomberg U.S. High Yield Index.
The leveraged loan primary market started the new year hot in 1Q2022, with $72.7 billion of supply in the first month alone, the second-busiest January on record, according to LCD. That represents 67% of the first quarter’s total institutional volume of $108.5 billion (as of March 21).
McKinsey & Company recently published a Global Private Markets Review that included an assessment of private debt. “Fundraising growth continued in private debt, the only private asset class to grow fundraising every year since 2011, including through the pandemic. This cyclical resilience is partially driven by the diversity of private debt substrategies: when one zigs, another usually zags. Over the longer term, growth has been driven by a dramatic expansion in direct lending strategies, which have accounted for 73% of fundraising growth in the last decade.”
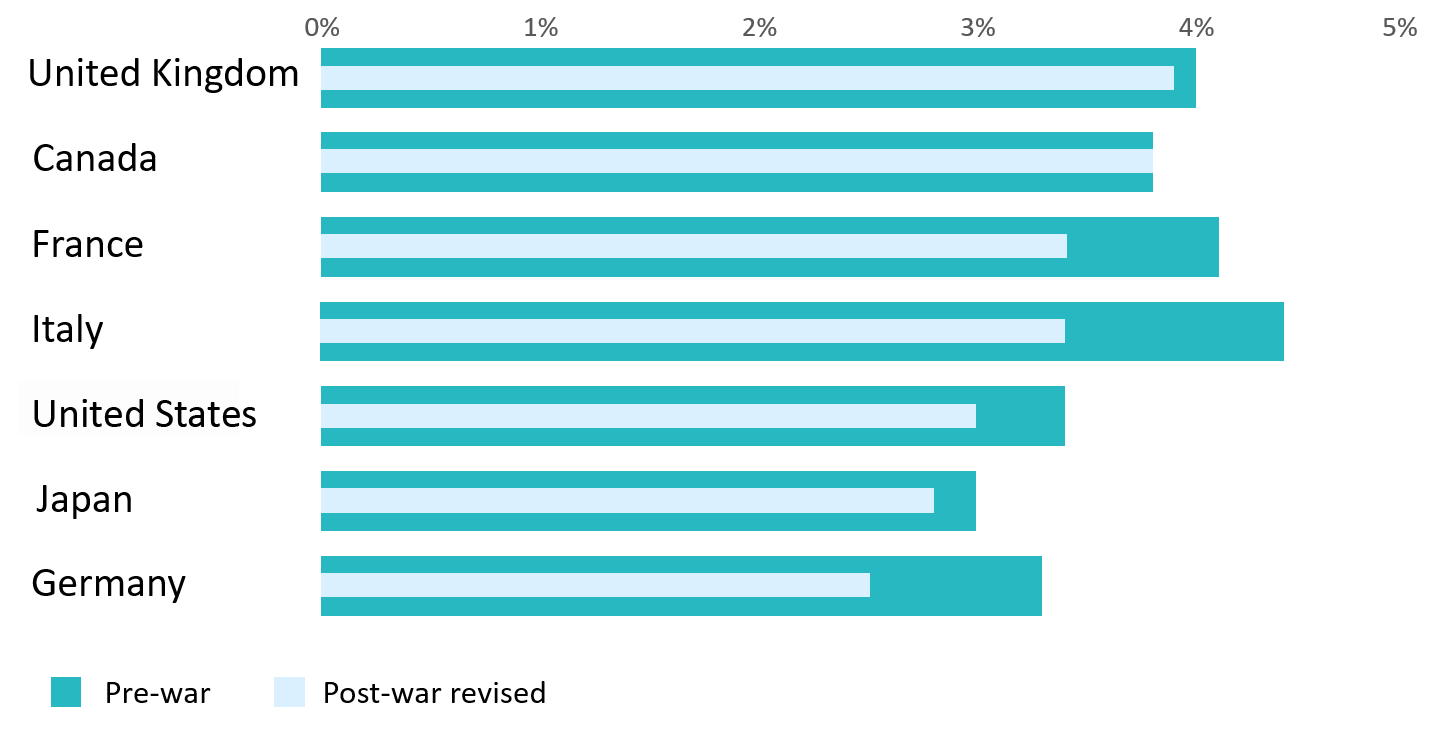
Source: Data: Economist Intelligence Unit report published March 29, 2022; Chart: Will Chase/Axios
Source: Environmental Protection Agency; Plant Proteins; Insider
Shaping the Future of the Financial Planning Industry: A Conversation with Dasarte Yarnway
Read More >>Sign-up for The Signal, a monthly rundown of what moves took place in the credit market and our latest educational and thought leadership content.
CION will use the information you provide to be in touch with you and provide updates. Feel free to change your mind at any time by clicking the unsubscribe link the email you receive. We will never share your information and will treat it with respect.