Q2 2026 Outlook: Chaos Or New Order: Does It Matter?
Q1 was, in short, a lot.
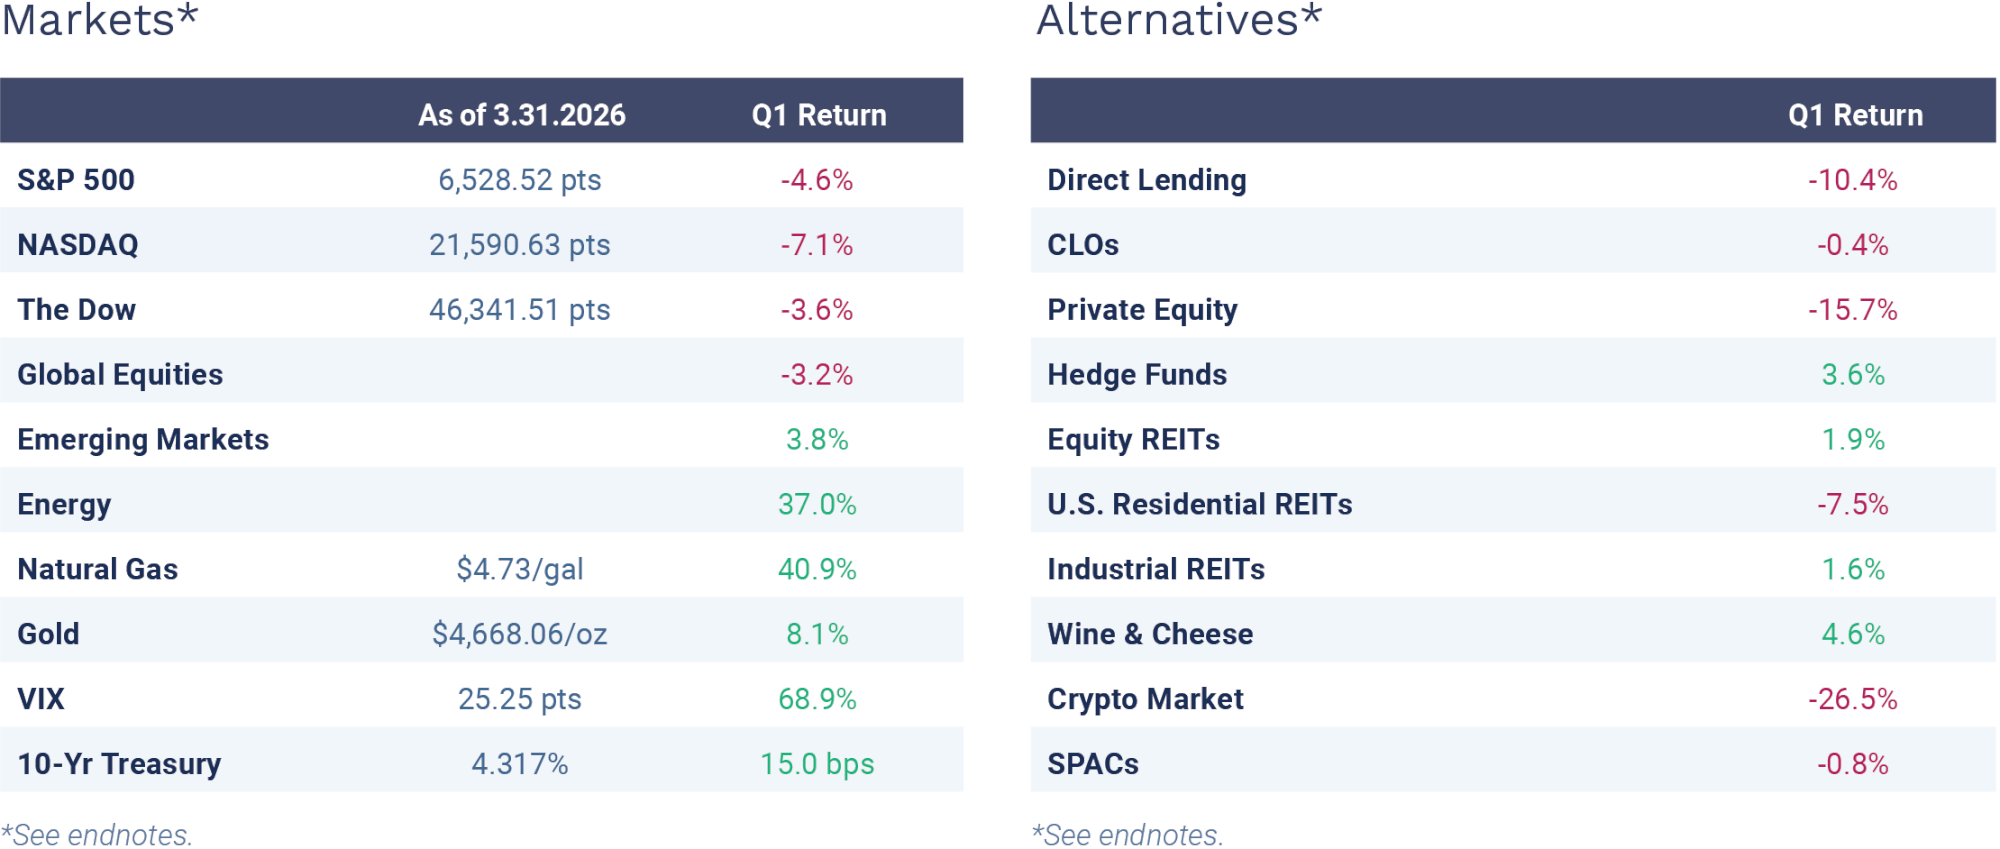
In the first quarter of the year, a new conflict ignited in the Middle East. Oil cleared $100 a barrel. The VIX spiked. Hyperscalers committed to spending more on data centers than the entire U.S. energy sector spends on everything. And alts managers saw their stock prices decline as concerns over annual recurring revenue (ARR) loans, generally used to lend to SaaS/subscription-based software businesses, and private credit claimed headlines.
Some safe havens didn't work. Gold rose over $5,000 an ounce, then unexpectedly plummeted by nearly $1,000. Bitcoin dropped 25%. And yet, the financial system did not break. Despite all the negative news, the financial markets remained relatively stable. Earnings growth remains strong. Even the tech-heavy NASDAQ was down less than 6% for the quarter, nowhere near the 20% decline that marks a bear market.
What should investors think about now? This outlook examines the three forces dominating investor attention heading into Q2: (1) the Iran conflict and its energy shock, (2) the maturation and testing of private credit, and (3) the necessary growth of infrastructure. We also offer a framework for thinking about key market themes for Q2 and beyond.
U.S. and Global Market Summary
War Derails a Strong Growth Trajectory: S&P Global Ratings now forecasts 2.2% U.S. GDP growth in 2026 after the Middle East conflict erased S&P’s 2.5% expected upgrade. Global growth had just returned to its long-run trend rate in February before the strikes on Iran upended the outlook.
Consumer Confidence Cracking: The Michigan Consumer Sentiment Index, which captured more post-conflict responses, plunged to 53.3 in March with inflation expectations jumping to 3.8%. Consumers may be absorbing today's costs, but confidence in what's coming next is eroding fast.
Labor Market Cracks Begin to Show: February payrolls fell by a revised 133,000, a surprise miss that signals weakening labor demand. S&P now expects just 0 to 50,000 monthly job gains through 2026. Fed Chair Powell put it bluntly at his March 18th press conference: after adjusting for revisions, there has been effectively zero net private-sector job creation over the past six months.
Economic Performance
Growth Momentum Fades Under War Pressure: The Atlanta Fed's GDPNow model estimates Q1 2026 real GDP growth at 1.6% as of April 2nd, down from 3.1% in late February. The Conference Board has already revised its 2026 full-year GDP forecast down to 2.0% to reflect the war's growing economic drag.
Labor Market Deteriorates: Nonfarm payrolls fell by 133,000 in February while the unemployment rate held at 4.4%, marking the third payroll decline in the past five months. The downturn follows a revised loss of 17,000 jobs in December, with federal government employment down 330,000 since October 2024, equal to roughly 11% of its workforce.
Inflation Calm Before the Storm: March CPI rose 3.3% year-over-year and 0.9% month-over-month. RSM's chief economist projects a future jump to 3.5% in April as the energy shock cascades through the economy.
Housing Recovery Derailed by Rate Spike: The 30-year fixed mortgage rate climbed for a fourth straight week to 6.38% as of late March, erasing the brief dip below 6% seen in February.
Monetary Policy
Fed Holds Rates, Signals Increased Caution: The FOMC held the federal funds rate at 3.5%–3.75% at its March 18th meeting, the second consecutive pause after three cuts in late 2025. Powell noted meaningful internal movement toward fewer reductions in 2026.
Treasury Yields Surge: Treasury yields jumped as investors feared the Fed may not cut rates at all this year. The 10-year hit 4.39% and the 2-year reached 3.89% on March 20th, before pulling back as ceasefire talks emerged.
Fed Leadership in Flux: President Trump nominated Kevin Warsh to replace Powell, whose chair term expires May 15th. Powell will stay on until Warsh is confirmed.
Credit Market Performance
Credit Market Returns: Performance for Q1 2026: High yield (HY) (0.50%), investment grade (IG) (0.54%), leveraged loans (0.55%) and direct lending (10.4%). Direct lending took the biggest hit as credit fears soared.
Software Loans Stabilize After Steep Selloff: In March, software loans posted a slight rebound, gaining 1.26% and trimming the year-to-date loss to 5.85%. However, this leaves the sector deep in the red after seeing cumulative losses of roughly 7% through February.
Loan Demand Cools: Total loan demand fell to $39.6 billion in the first quarter of 2026, the lowest level since Q3 2024. This was driven by $7.5 billion of retail fund outflows during the quarter, reflecting current retail sentiment around credit.
The Iran Conflict: Energy as a Financial Variable
The Strait of Hormuz, when functioning normally, carries roughly 20 million barrels of crude and significant LNG volumes daily. When it doesn't, the effects ripple far beyond energy markets and into fertilizer prices, shipping insurance, airline fares, and consumer inflation everywhere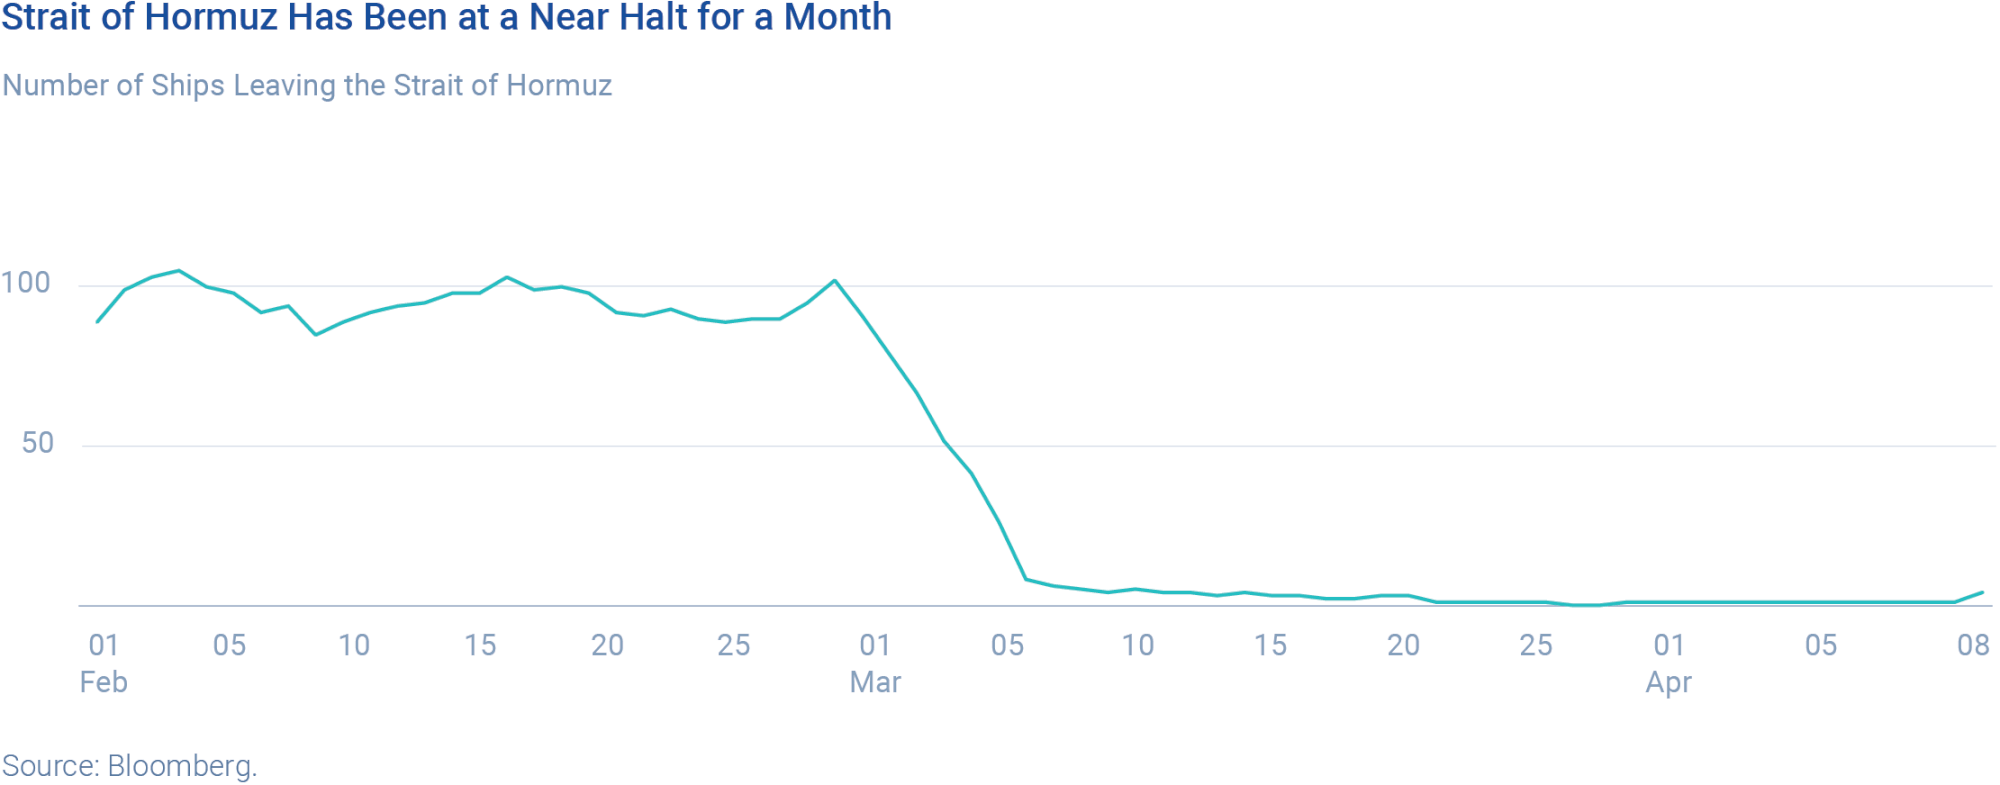
J.P. Morgan estimates that if Brent crude stays elevated through mid-year, global GDP growth in the first half of 2026 could be depressed at an annualized 0.6%. Not economy-ending, but sitting on top of already-elevated tariff pressures. The result: inflation, which investors had hoped was safely in the rearview mirror, is back. Brent has surged from roughly $81 to over $110 per barrel, a 35% move in two weeks. U.S. inflation is now projected toward 3%; the eurozone, toward 4%. Expected central bank rate cuts have been pushed out or may turn into raises.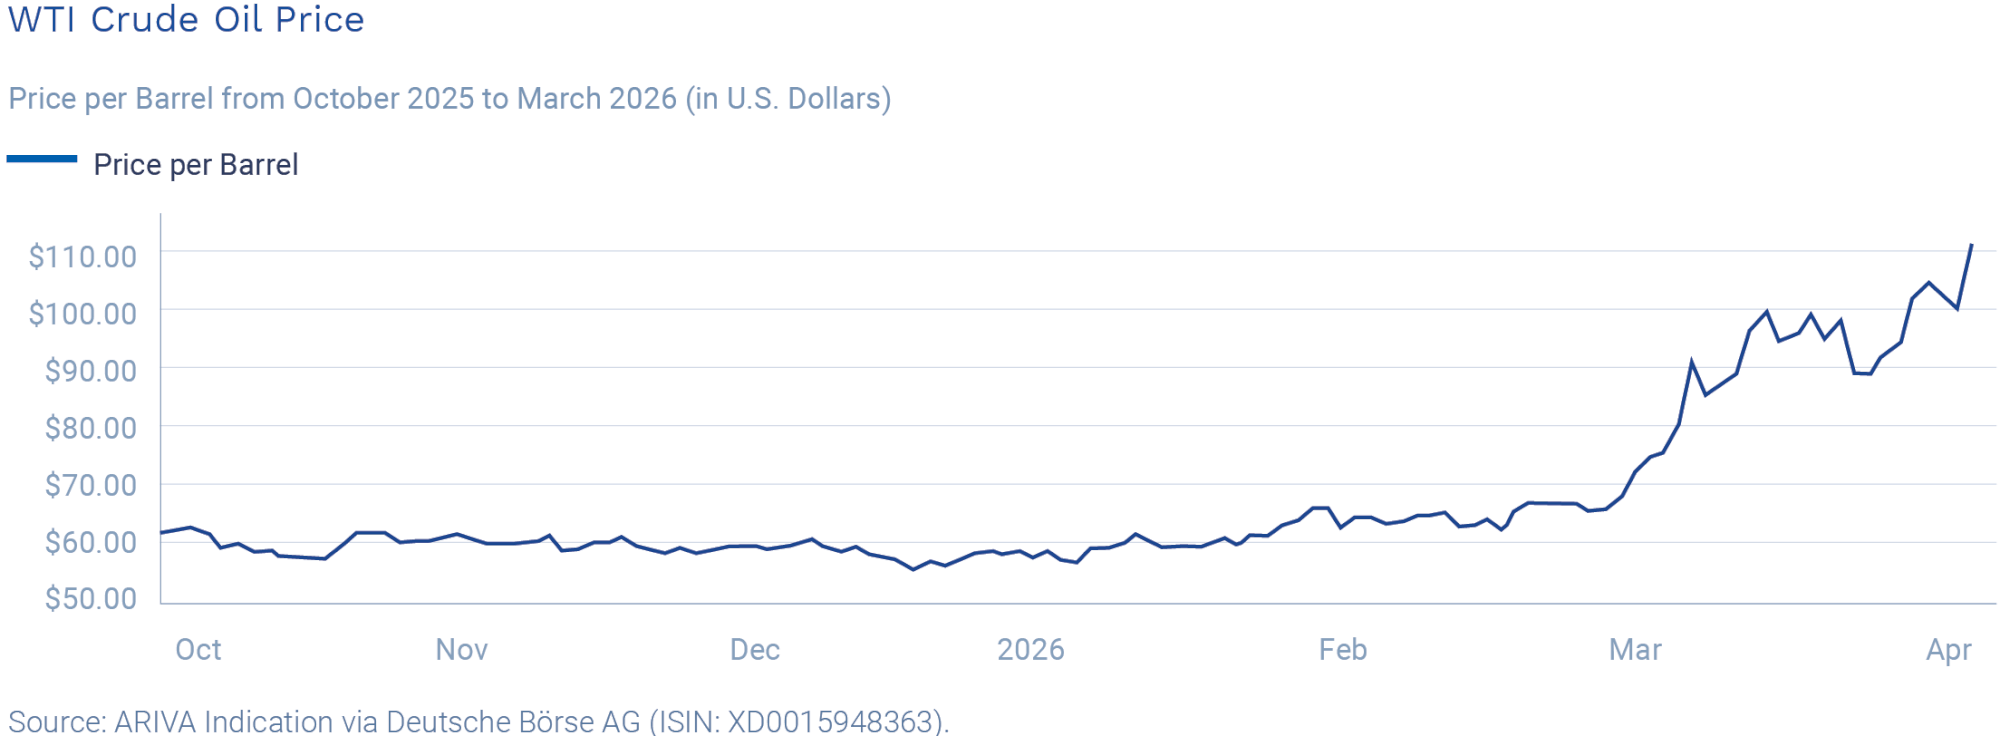
The defensive plays are obvious and crowded: energy producers outside the Gulf and defense contractors. The one sector that unambiguously benefits is defense. Government spending is set to rise materially across NATO and allied nations, and it has long duration. Drones, satellites, missile defense, and cybersecurity are infrastructure, not cyclical goods, and infrastructure gets funded regardless of what the Fed does.
Private Credit: Adolescence and Growing Pains
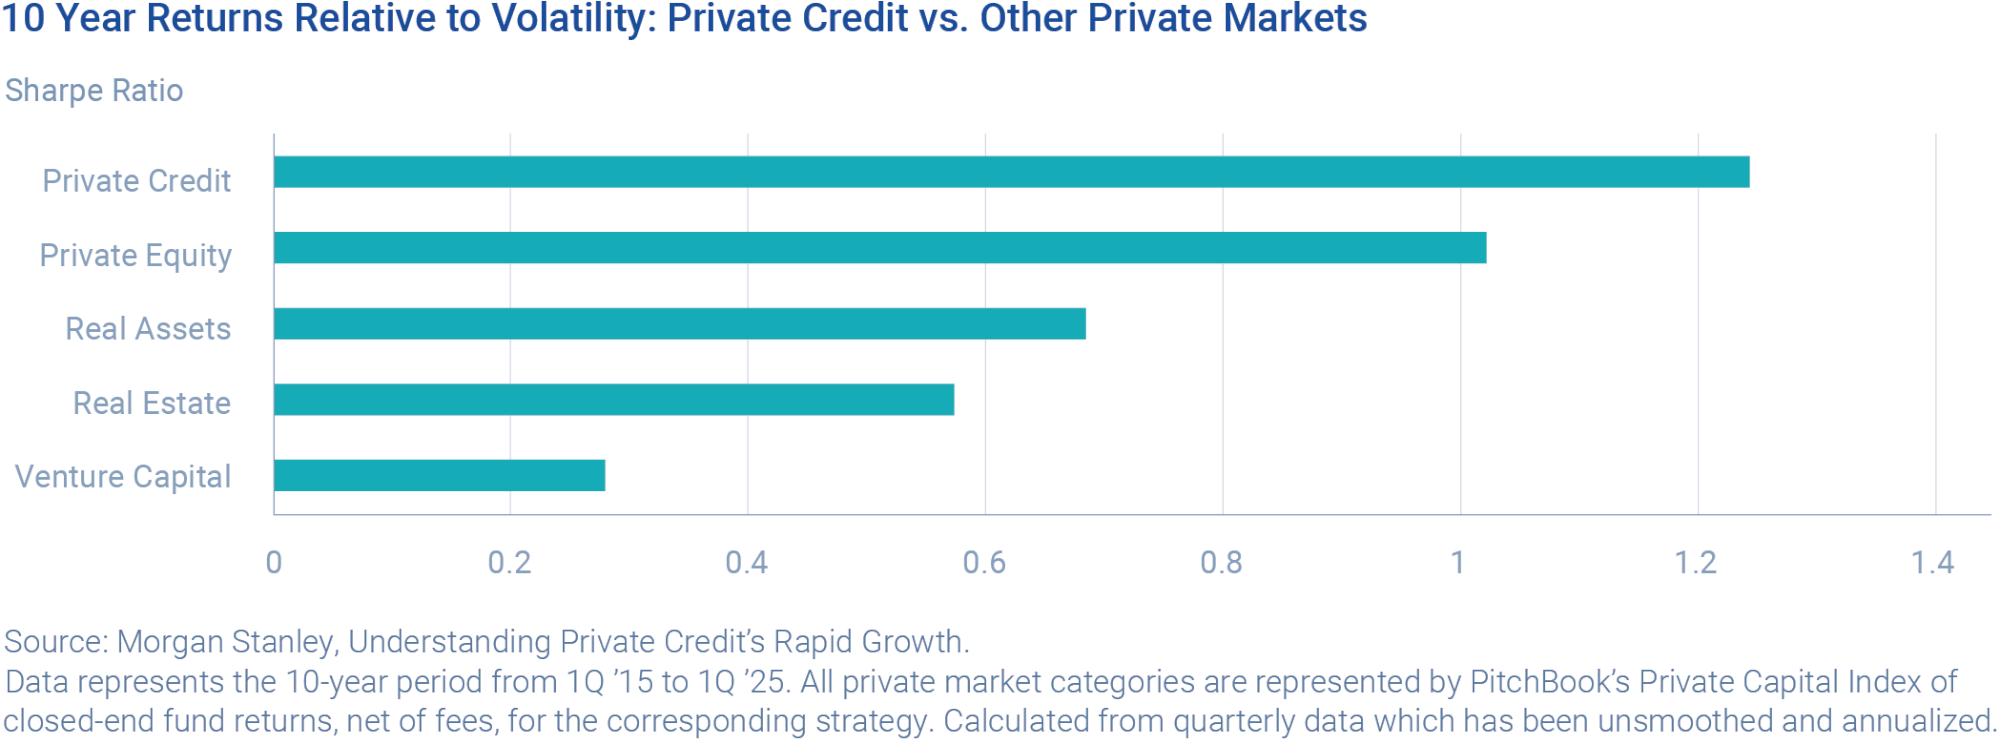
Direct lending has grown to over $1 trillion in assets under management, matching the broadly syndicated loan market in size. Moody's projects that the market will grow to $3 trillion by 2028. With scale comes complexity, and 2026 is where the asset class gets tested for the first time.
The good news: fundamentals remain healthy. Public market defaults are at approximately 1.25%, well below the 2.5% historical average. Over the last few years, direct lending has maintained an average 250 bps yield premium to equivalent public loans.
Expanding digital infrastructure has been a significant tailwind for the space and AI-related demand continues to grow exponentially. The less comfortable news is that the differences between tight and loose underwriting may now start to matter. Larger alternative asset managers have generated headlines around rising payment-in-kind (PIK) usage and redemption limits being hit.
The structural opportunity for private credit remains in the lower middle market. Companies with $10 to $50 million in EBITDA lack access to public capital markets, meaning certain lenders there have the resources and expertise to maintain real covenants, earn genuine illiquidity premiums, and face less competition from the broadly syndicated loan (BSL) market. J.P. Morgan's recommendation to focus on portfolios with "diversified sector exposure and seniority in the capital structure" is repeating what all good private credit managers already know.
Infrastructure: What’s Old Is New Again
There is something almost reassuring about infrastructure as an asset class. While the rest of the market debates AI multiples and geopolitical tail risks, someone still needs to widen the roads, modernize the power grid, and expand the airports. These are not optional activities. Infrastructure needs replacement whether or not the budget cycle approves them.
The scale of global need is staggering. Aberdeen Investments estimates the world requires nearly $64 trillion in infrastructure investment over the next 25 years just to keep pace with growth, urbanization, and the demands of decarbonization. The U.S. alone faces a projected $3.8 trillion gap between projected spending and actual need through 2040.
The mismatch between need and public capacity to fund it is precisely what makes infrastructure compelling as a private asset class. Government balance sheets are strained across developed markets. Public deficits are widening, not narrowing. That structural retreat of sovereign capital is pulling private money into what was previously considered exclusively public territory, and the flow shows no sign of reversing.
Private infrastructure deal flow hit $1.56 trillion globally in 2025, offering spreads of 200–250 basis points over public comparables for investment-grade issuances and materially more for high-yield deals.
For private investors, the asset class offers something increasingly scarce: cash flows that are contracted, inflation-linked, and structurally insulated from public equity volatility. Infrastructure doesn't care about the Fed's next meeting. A toll road in France or a regulated utility in Texas generates essentially the same revenue whether the VIX is at 15 or 35. That is not the same as saying it is risk-free; regulatory risk, interest rate sensitivity, and execution risk are all real. But the risk profile is genuinely different from public equities, and the correlation benefit, deriving from infrastructure being historically uncorrelated with the broader equity market, is genuine.
Closing Thoughts
There is an old market saying that "investors climb the wall of worry." The Q1 2026 wall was particularly high. Wars, energy shocks, sticky inflation, an uncertain Fed, and a trillion-dollar technology bet that hasn't yet shown profitability.
And yet, the global financial system has endured. Credit kept flowing. Private markets kept lending. Gold went to $5,000 and then corrected. The S&P 500 fell 4.5% in three weeks and then stabilized.
The experience is a useful reminder that the role of a successful long-term investor is not to predict which wall of worry comes next, but to build a portfolio durable enough that it doesn't matter much which wall it is.
Q2 may bring more clarity on the Iran conflict's duration and, therefore, on oil prices, inflation, and the Fed. It may also bring continued evolution in private credit as the asset class navigates its first real stress test. And it will almost certainly bring at least one development nobody currently has in their model. We believe long-term investors can sleep well at night.
Endnotes
Source: Bloomberg Index Services Limited. BLOOMBERG® is a trademark and service mark of Bloomberg Finance L.P. and its affiliates (collectively “Bloomberg”). Bloomberg or Bloomberg’s licensors own all proprietary rights in the Bloomberg Indices. Bloomberg does not approve or endorse this material or guarantee the accuracy or completeness of any information herein, nor does Bloomberg make any warranty, express or implied, as to the results to be obtained therefrom, and, to the maximum extent allowed by law, Bloomberg shall not have any liability or responsibility for injury or damages arising in connection therewith.
“S&P 500” represented by the S&P 500 index. “NASDAQ 100” represented by the NASDAQ 100 Index. "The Dow" represented by the Dow Jones Industrial Average. "Global Equities" represented by MSCI ACWI Index. “Emerging Markets” represented by the iShares MSCI Emerging markets ETF. "Energy" represented by Energy Select Sector SPDR Fund (XLE). “Natural Gas” represented by the United States Natural Gas Fund LP. “Gold” represented by the SPDR Gold Shares. “VIX” represented by the Chicago Board Options Exchange’s CBOE Volatility Index. "10-Yr Treasury" represented by U.S. 10-Year Treasury Yield. “Direct Lending” represented by the DLX Direct Lending Index. “CLOs” represented by the Palmer Square CLO Debt Index. “Private Equity” represented by the Invesco Global Listed Private Equity ETF. “Hedge Funds” represented by the Bloomberg All Hedge Fund Index. “Equity REITs” represented by the MSCI World Equity REIT Index. “U.S. Residential REITs” represented by the MSCI US Residential REIT Index. "Industrial REITs" represented by FTSE NAREIT Equity REITS. "Wine & Cheese" represented by the Bloomberg Wine & Cheese Index. “Crypto Market” represented by the Bloomberg Galaxy Crypto Index. "SPACs" represented by S&P SPAC Index.
The indices shown are provided solely for illustration purposes and not indicative of any investment. You cannot invest directly in an index. They have not been selected to represent appropriate benchmarks or targets for the strategy. The indices include the reinvestment of dividends, interest and other earnings and which have not been adjusted for management fees or expenses.
The information contained within is for educational and information purposes ONLY. It is not intended nor should be considered an invitation, inducement to buy or sell any security or a solicitation to buy or sell any security. The information is not designed to be taken as advice or a recommendation for any specific investment product, strategy, plan feature or other purpose in any jurisdiction, nor is it a commitment from us or any of our subsidiaries to participate in any of the transactions mentioned herein. Any commentary provided is the sole opinion of the author and should not be considered a personal recommendation. This is also not intended to be a forecast of future events nor is this a guarantee of any future result. Both past performance and yields are not reliable indicators of current and future results. Information contained herein was obtained from third party sources we believe to be reliable; however, this is not to be construed as a guarantee to their accuracy or completeness. Observations and views contained in this report may change at any time without notice and with no obligation to update. All investments carry a certain degree of risk, including possible loss of principal and there is no assurance that an investment will provide positive performance over any period of time. There are specific risks associated with investing in various types of financial assets and in different countries. The information contained within should not be a person’s sole basis for making an investment decision. One should consult a financial professional before making any investment decision. Investors should ensure that they obtain all available relevant information before making any investment. Financial professionals should consider the suitability of the manager, strategy, and program for their clients on an initial and ongoing basis. CION Securities, LLC, Member FINRA/SIPC.